

The Daytrader's Toolbox - Time and Sales
The Daytrader's Toolbox - Time and Sales
in this article, I will describe its essential functions, concluding with a series of examples which should serve as an aid on how to read the Tape to support your analysis

The context of order flow dynamics is rich in tools that seem complex to interpret, adorned with lights, numbers, and geometric shapes of the most disparate contours. The heatmap is one of the most exciting tools in this field - especially for novices. And, precisely for this reason, in this article, I will write nothing about it.
Let's ask ourselves a simple question: what moves the market?
The answer is just as simple: the market orders.
Speaking about simplicity, there is a simple but quite spartan tool that can give the trader multiple real-time information on:
Which category of market participants are in control of the auction (short-term vs other-timeframe);
What is the average size of a market order on the reference market and, consequently, what type of size is above average;
What is the average speed of the market and, consequently, when to expect a reaction.
This tool is Time and Sales, and in this article, I will describe its essential functions, concluding with a series of examples which should serve as an aid on how to read the Tape to draw valid conclusions which support your analysis.
What is the Time and Sales window?
Time and Sales (T&S) is an independent tool from the price chart. Its function is to print on a sort of vertical scrolling "tape" the market orders that hit the Bid price and the Ask price, along with the relative timestamp, price and quantity of executed contracts.
In the following paragraphs, I will show you how to read it.
Reading the Tape
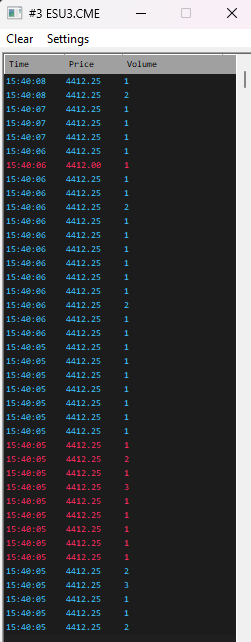
From left to right, for each execution, you can observe, in order: time, price, and volume.
Orders that hit the Bid price (market sell) are reported in red, and those that hit the Ask price (market buy) are in blue.
The T&S in its default settings is presented as unfiltered, printing every single executed operation on the Tape.
Given the relatively high update frequency, getting lost in the details is relatively easy. Therefore, the best trading platforms give the user the possibility to highlight particular anomalies recorded in the flow, such as:
Sweeps: market orders that cause the uptick or downtick of the price;
Volume threshold: highlights those market orders with a volume greater than or equal to "n" contracts in a different colour.
These two elements play a crucial role when reading the Tape. To properly understand how, it is necessary to stop for a second and see what distinguishes retail and HTF (short-term) activity from the other-timeframe participants.
Retail activity vs non-retail
The more liquid a market is, the higher the volume of market orders required to move the price.
Most market participants do not have the necessary leverage to exhaust the resting liquidity on a price tick in almost any Futures market.
If you stare at the unfiltered T&S for a while, you can progressively start to notice that most of the executed orders are equivalent to a single contract. During low-volume rotational phases, the price rotates from one area of liquidity to another with a relatively fixed rhythm, driven by a constant flow of small orders that includes short-term retail activity and HFT market-making activity.
When significative volume is recorded on the T&S, it is a signal of active participation by a rather large entity, which is reasonably equipped with enough leverage to repeat the same operation several times, thus exerting an influence on the market.
Non-retail participants are not aware of the activity of their competitors and, precisely because of the size with which they operate, they must necessarily:
Monitor the activity of other non-retail participants;
Gradually build their positions in high liquidity areas in such a way as to limit slippage and scale out their profit-taking in the same way.
The T&S allows highlighting abnormal activity in terms of volume and execution frequency through the highlighting features of transactions that exceed a certain number of contracts or by creating a filtered T&S.
Filtered Time and Sales
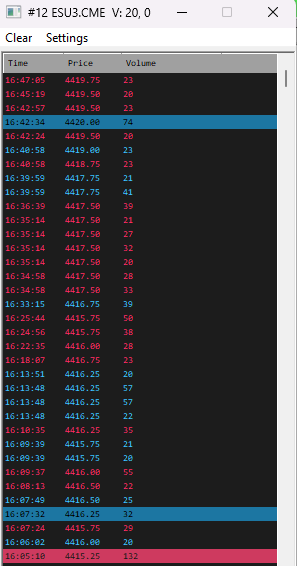
The filtered T&S allows showing only the transactions that exceed "n" contracts.
The example in the image above shows a filtered tape on ES for market orders with a volume greater than or equal to 20 contracts.
In this way, it is immediately evident to the trader whether a rotation is predominantly supported by a progressive aggregation of small transactions or, on the contrary, whether it is driven by non-retail volume participation.
In the first case, as in the context of a low-volume pullback, the window will not update, remaining static.
In the second case, however, you can observe a constant update of the Tape, listing newly executed market orders that fit the filtering criteria.
This way, the trader can intuitively understand which market participants currently have control.
Example reading of the filtered T&S on ES
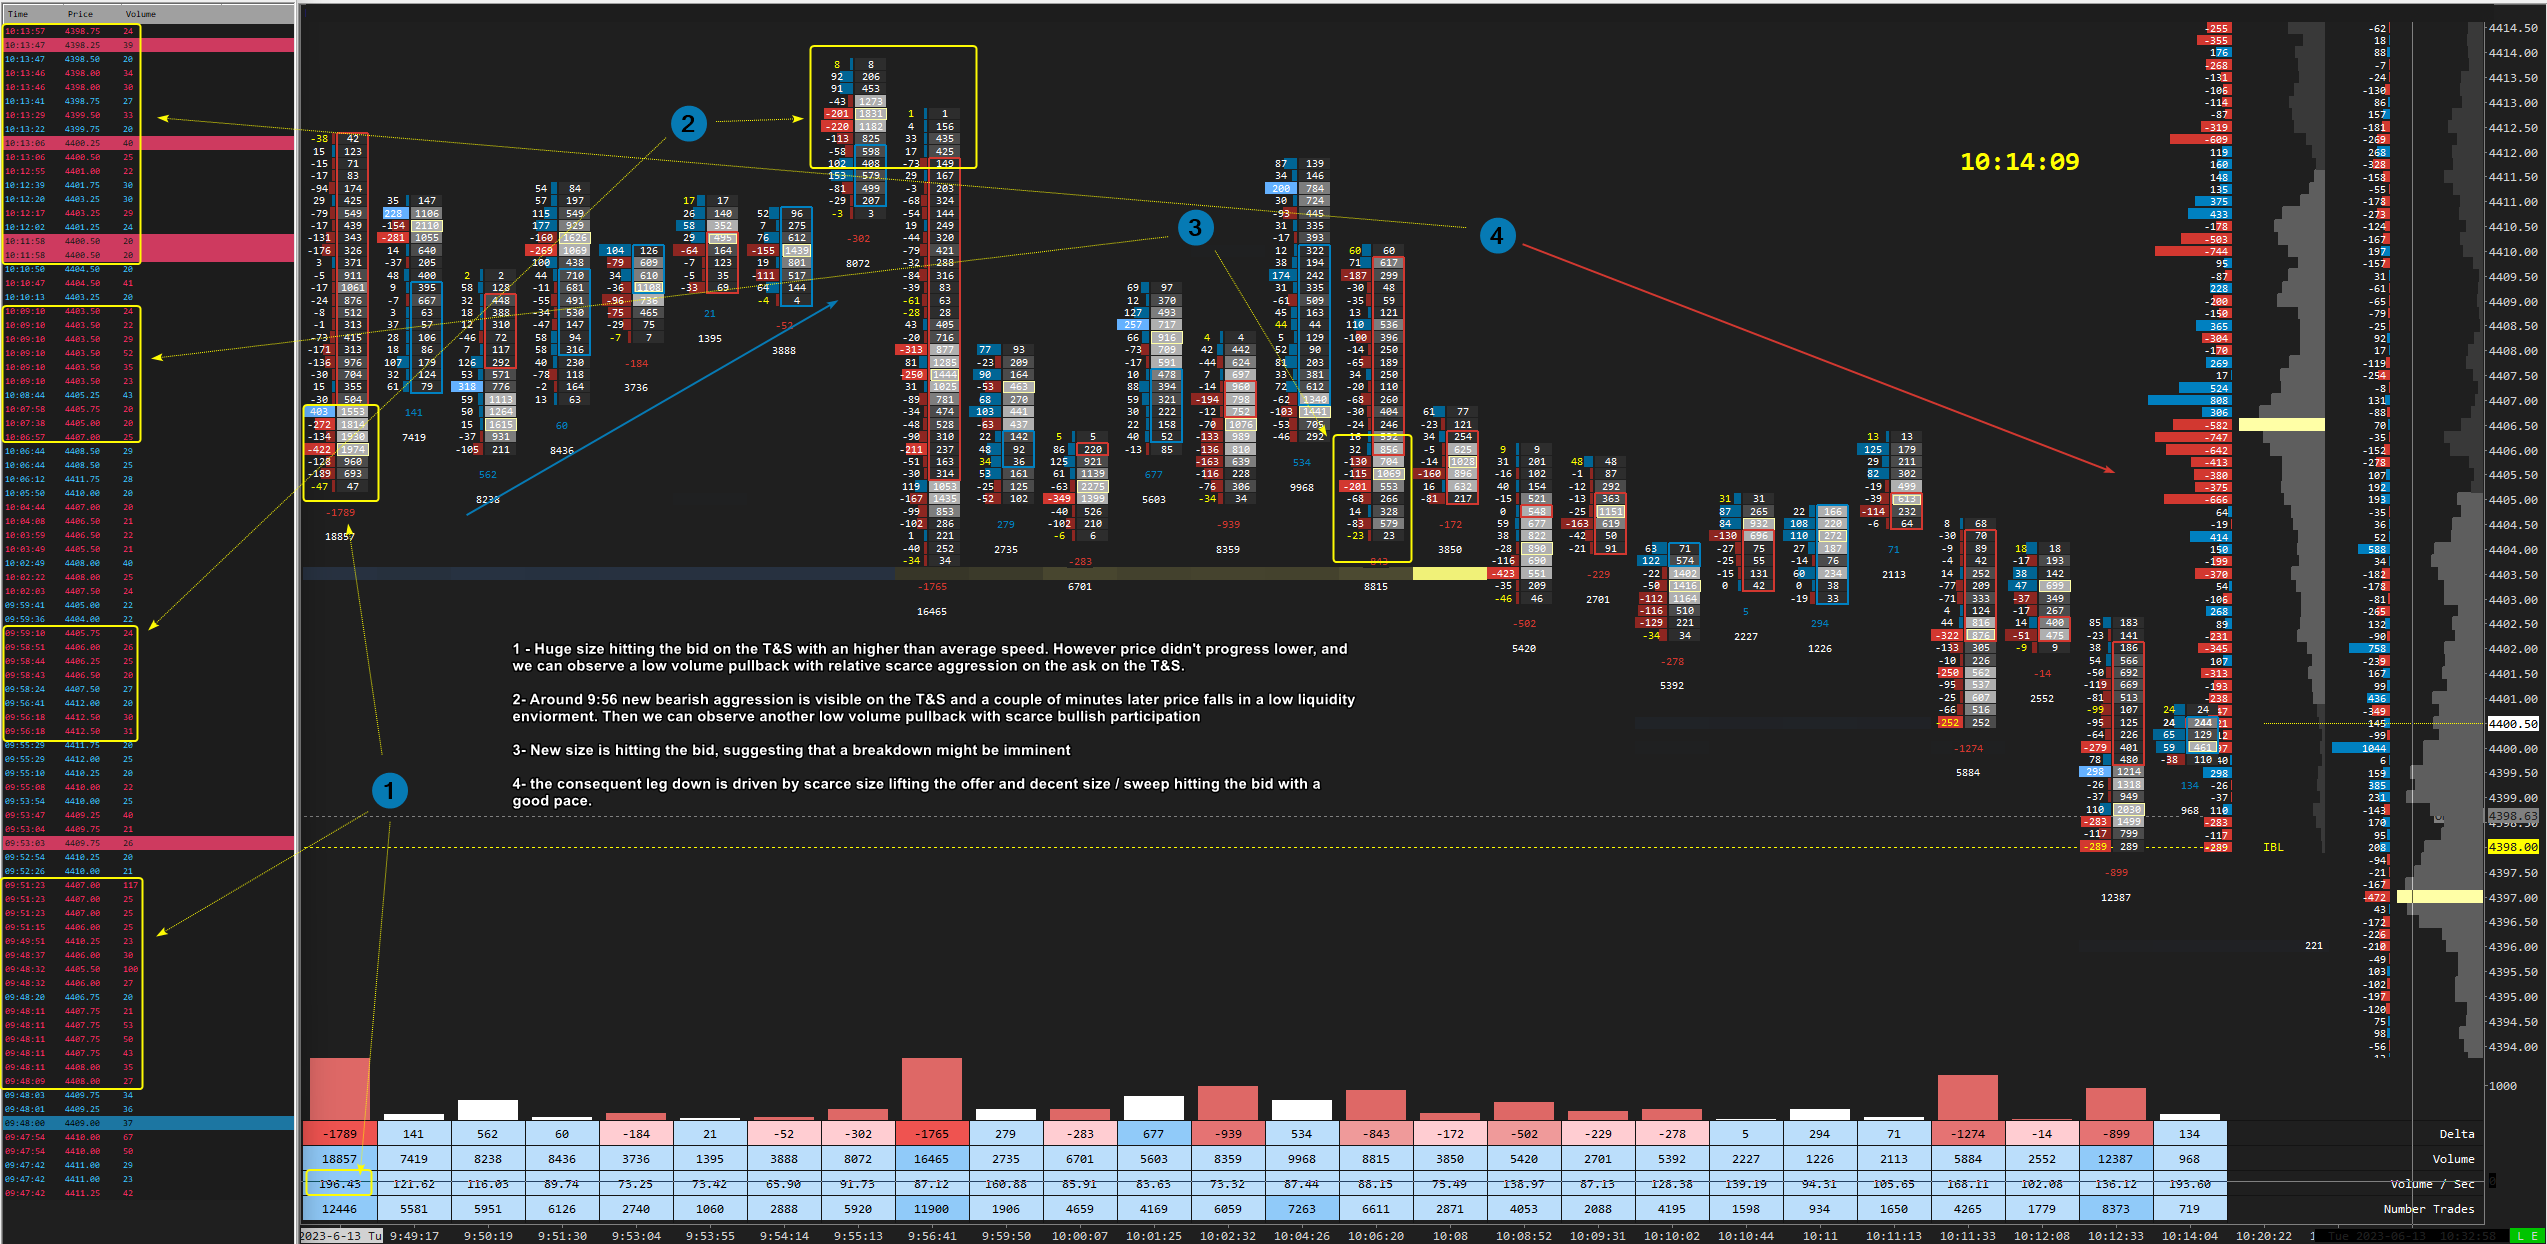
The Bid side liquidity is hit by significant volume with abnormal frequency. However, the price does not move, highlighting local absorption that leaves room in the following minutes for a low volume pullback, characterised by a lack of aggression on the Ask side, which we can evince by the fact that the T&S does not update, therefore suggesting that the pullback is predominantly supported by small sized market orders.
Around 9:56 (NY time), relevant volume aggression on the Bid side resting liquidity is seen again on the T&S. Then, a couple of minutes later, the price plummets downwards in a context of low liquidity. Once the impulse is over, another low-volume pullback with little participation on the T&S can be observed.
The Bid side is hit by more significant volume, which suggests an imminent breakdown due to the exhaustion of the previously tested liquidity.
The subsequent downward movement is supported by good volume and various sweeps that continue to hit the Bid side and by little activity instead recorded on the Ask side.
Liking the article so far? Consider subscribing to this newsletter, and don’t forget to share it with your friends!
Why, then, should you use the unfiltered T&S?
The question might arise spontaneously. The unfiltered T&S is very fast, reporting every single execution; therefore, apparently difficult to read and even more difficult to derive an actual utility out of it. In reality, spending some time with the unfiltered T&S is essential to:
1- Understand the speed of the market
As a scalper, especially when approaching a new instrument, it is common to open a trade, for then close it at break-even a few minutes later, in the belief that too much time has passed, only to observe the price hit the hypothetical TP a few moments later when volume finally shows up.
The explanation is that each market has its own "rhythm" and, therefore, its average trading frequency, measured in volume per second (V/s). The unfiltered T&S, in this sense, can act as a "metronome" of the market, helping the trader to be more in tune with the new instrument.
Finally, if you understand the "normal" trading frequency, you also realise what deviates from the norm. Usually, the market speed tends to increase when non-retail participants come into play, up to having its peak in capitulation events, due to the perfect storm caused by the simultaneous trigger of stop orders composed of stop losses, stop triggers and liquidations.
2- Understand which sizes are abnormal
As mentioned, the price moves when the volume of the executed orders exhausts the liquidity resting on the book. To achieve this event, we need serious size to hit the Bid or Ask price. However, what is perceived as "serious" size can vary a lot depending on the instrument.
A market buy of 50 contracts on ES has a different weight than an equivalent order on ZN, where much more volume is needed to move the price due to the higher liquidity.
The unfiltered T&S provides the trader with the perfect data to understand what size can actually move the price significantly, thus providing useful information to calibrate the filtered T&S, but also to read DOM and Footprint with greater awareness of what order-flow anomalies to keep an eye on.
3- Visualise the sweeps
Sweeps, as mentioned earlier in this previous article on liquidity and volume, are market orders that, due to the absence of adequate liquidity on the price tick on which they were executed, end up causing an uptick or downtick.
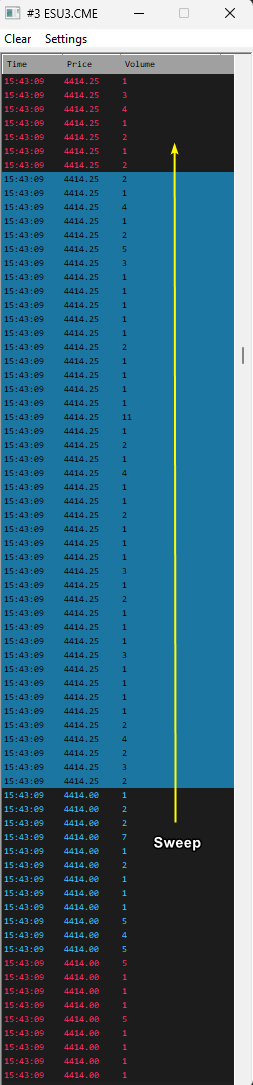
Sweeps on the unfiltered T&S can highlight a state of imbalance in a context of low liquidity, or, on the contrary, market orders so large as to cause an uptick or downtick even in the presence of normal liquidity or even higher than average.
Distinguishing the two events is possible by observing the size recorded at the highlighting of the relative sweep.
Example reading of the unfiltered T&S on ES

This first screenshot shows how the current movement is predominantly supported by small size, oscillating between 1 and 2 contracts, with a prevalence of orders that hit the Bid side (market buy).
This suggests that we are in the middle of a rotation controlled by short-term participants. Therefore, we must evaluate how the order flow will react to the first area of interest where there is more liquidity than normal.
But let's now see an example of a reversal seen only through the unfiltered T&S.
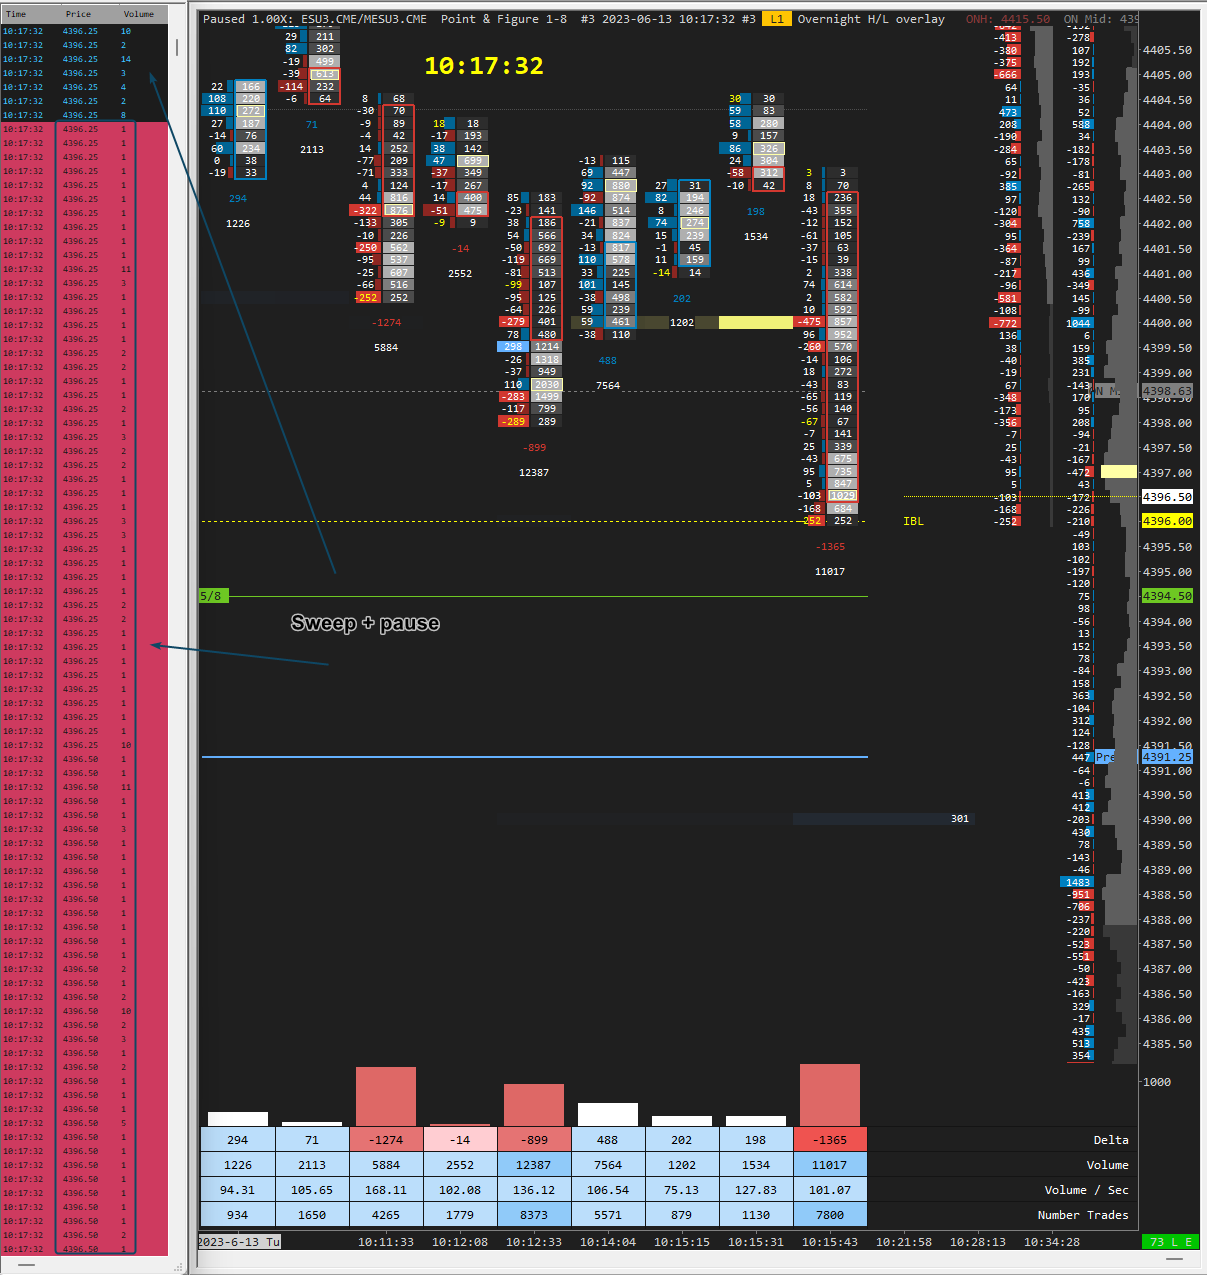
In this screenshot, you can observe good aggression on the Bid side that culminates with a sweep, but then you can notice a pause, followed by a good volume of market buys, probably short covering. At this point, it is necessary to carefully observe the behaviour of the order flow during the subsequent pullback.
For the bearish trend to continue, we want to see a slow activity of aggression on the Ask side, composed predominantly of small contracts, then followed by a new significant attack on the Bid side (market sell).
As for the hypothesis of a reversal, instead, the signs to identify are:
Lack of follow-through of significant sell volume;
Increase in volume hitting the Ask side after the pullback.
In this context, you can notice that little volume hits the Bid side after the pullback. At this point, we expect the aggressive sellers who opened short positions at the end of the movement to liquidate their positions.

As observable from the sweeps and the significant volume hitting the Ask side, the liquidation of the short positions absorbed at the bottom of the previous candle caused a counter-rotation.
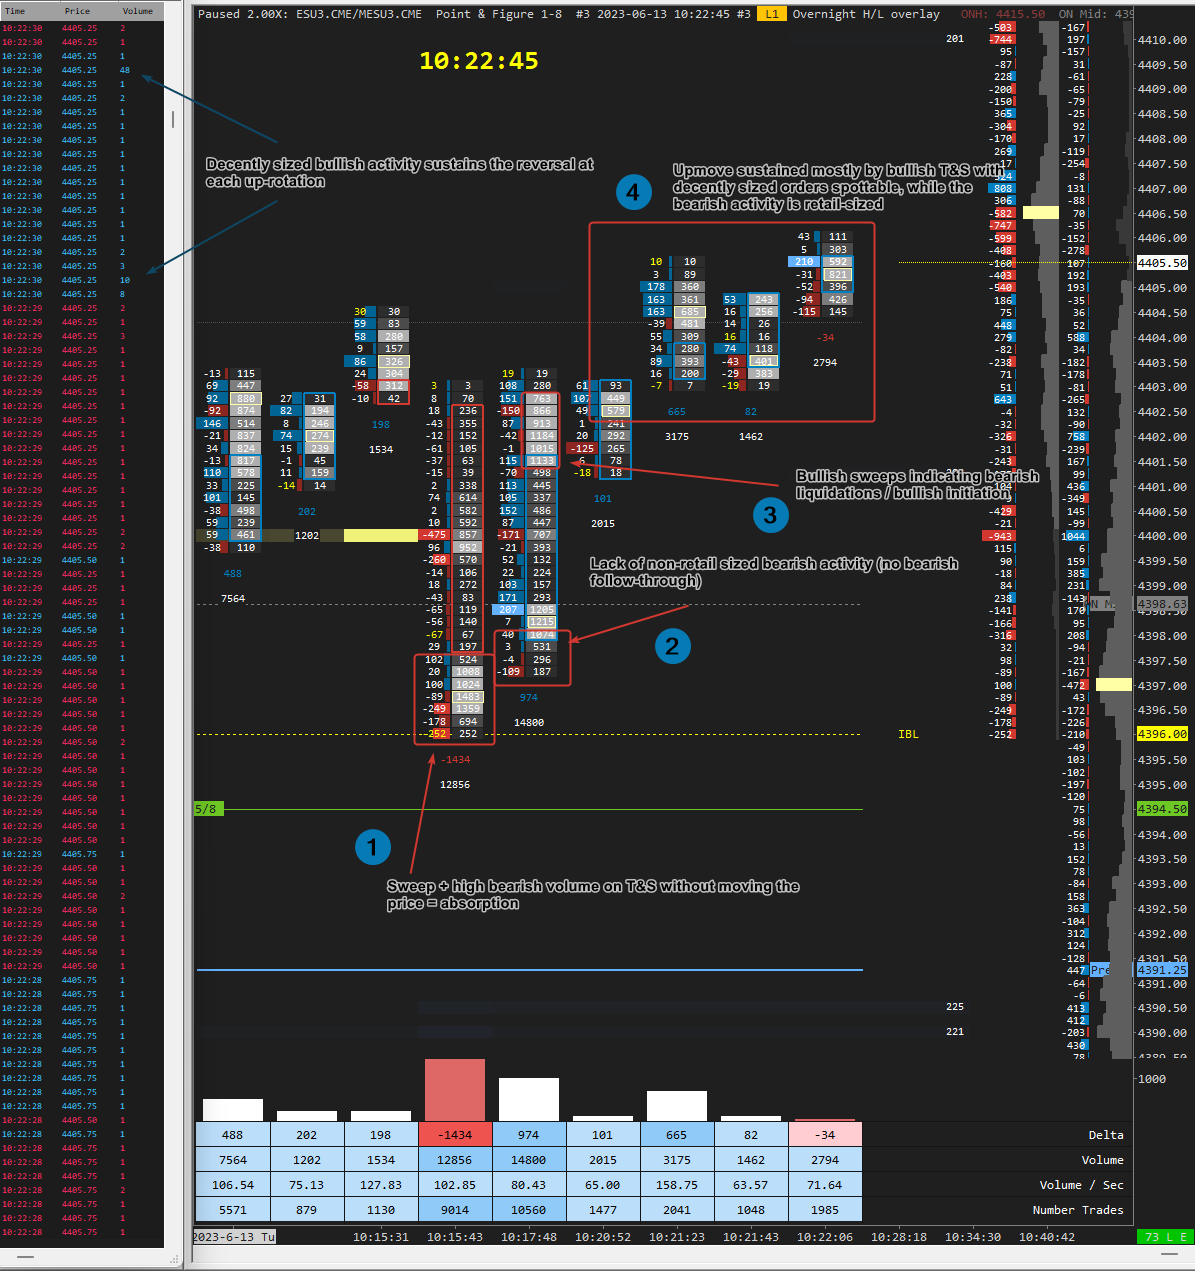
Finally, the price proceeds upwards, supported by good size hitting the Ask side, alternating with rather timid aggression on the Bid side.
The whole thing can be summarised in the following 4 steps:
High bearish volume composed of sweeps fails to move the price, indicating clear absorption;
Lack of follow-through of bearish activity after the physiological pullback;
Aggression activity on the Ask side indicates the liquidation of the bearish positions opened during the absorption event;
Bullish follow-through with good buying volume continues to support the upward rotation.
The Winning Combination
Filtered or unfiltered, that is the question. And the answer is both.
Once you have found the ideal filter value to use with the filtered T&S, both windows can be placed side by side to have an excellent view of the rhythm of the market, sweeps in contexts of low liquidity and understand who currently is in control of the auction (short-term vs other-timeframe).
In the following screenshots, we will see an example of a low-volume pullback after an apparent absorption.
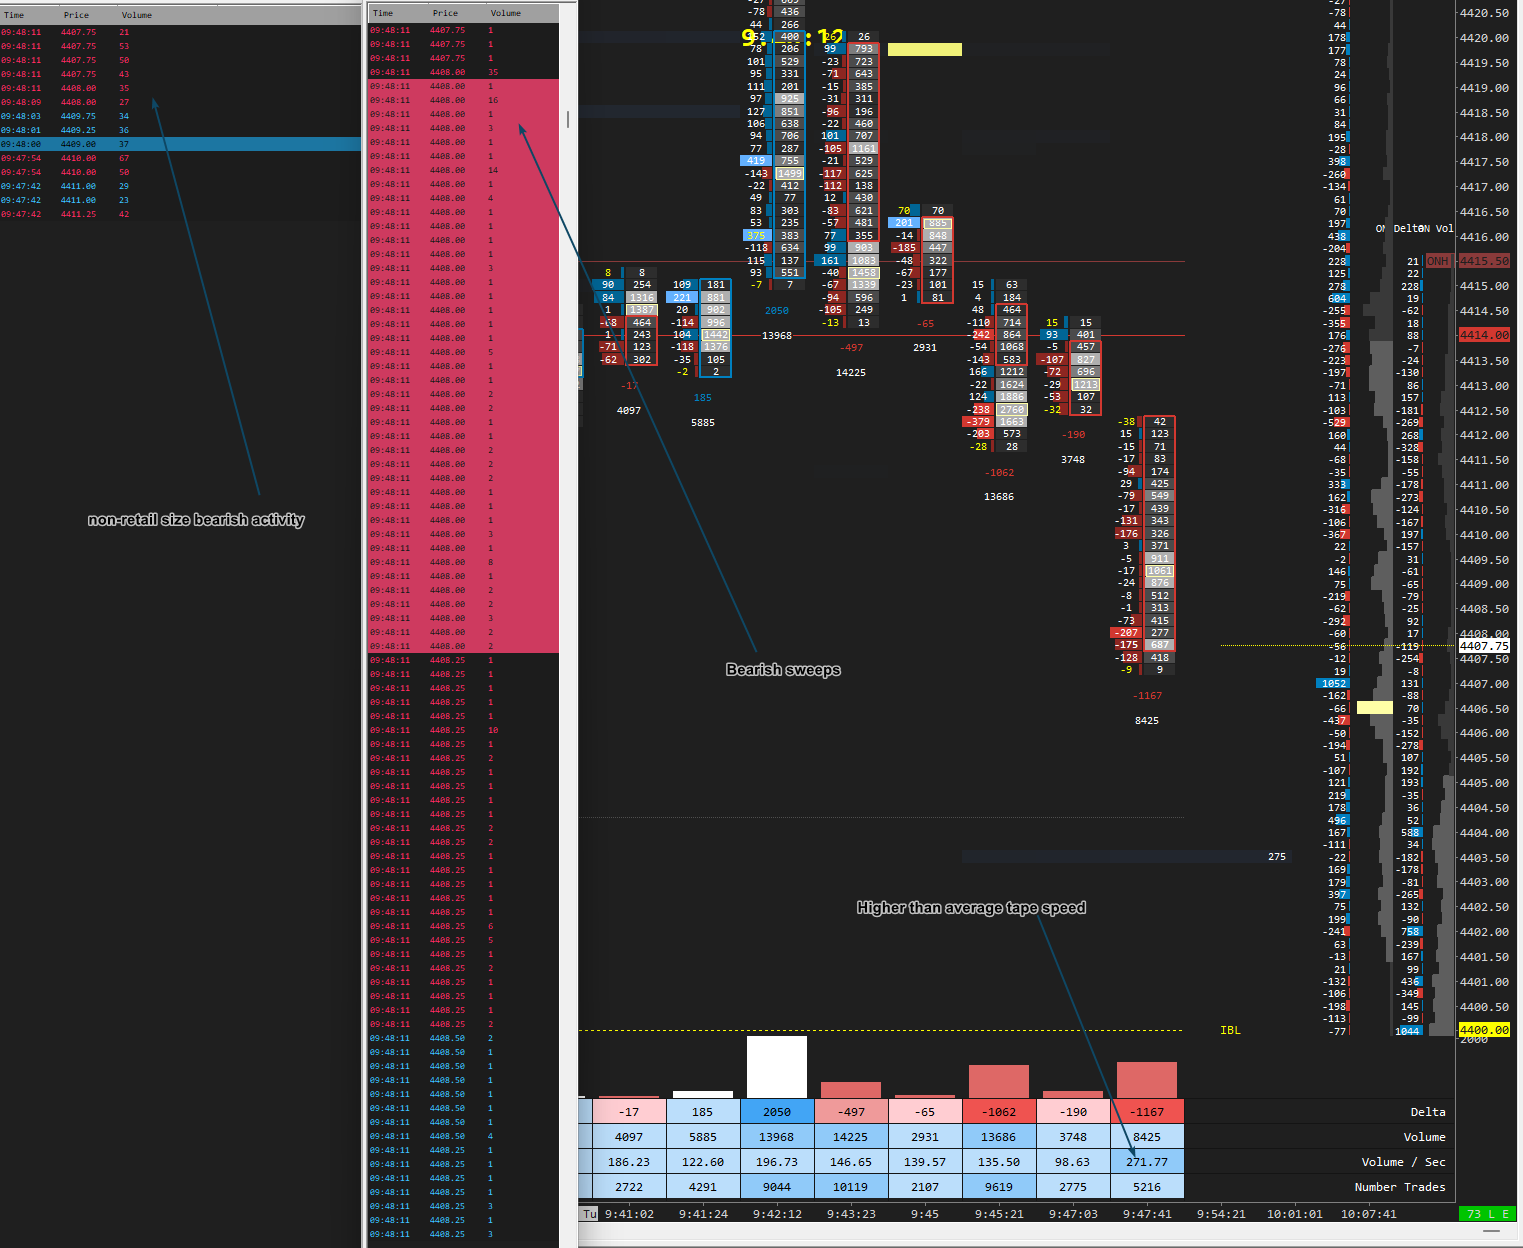
The impulse is supported by several market sell orders visible on the filtered T&S and by sweeps on the unfiltered T&S. .
A 100 contracts market sell is recorded on the filtered T&S, but after new liquidity is reloaded on the book, the bearish activity attenuates, suggesting the possibility of an imminent pullback.
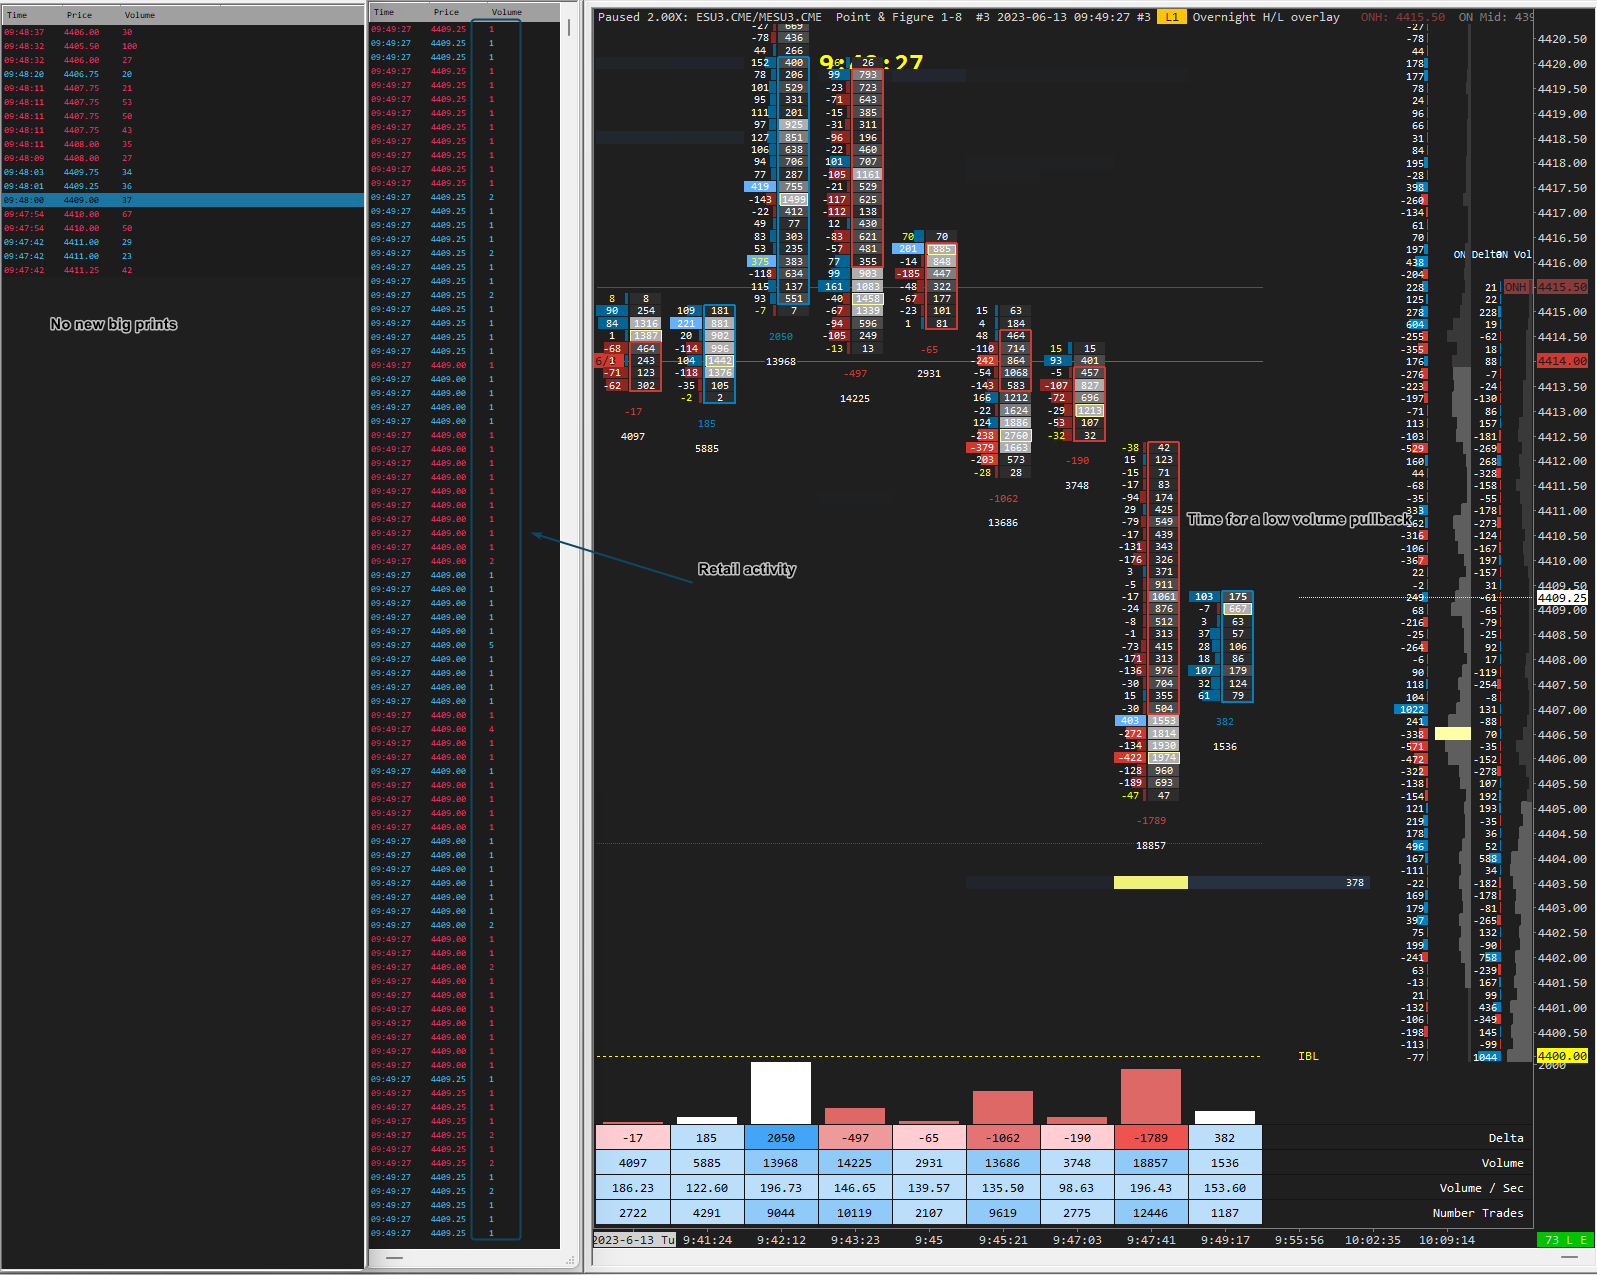
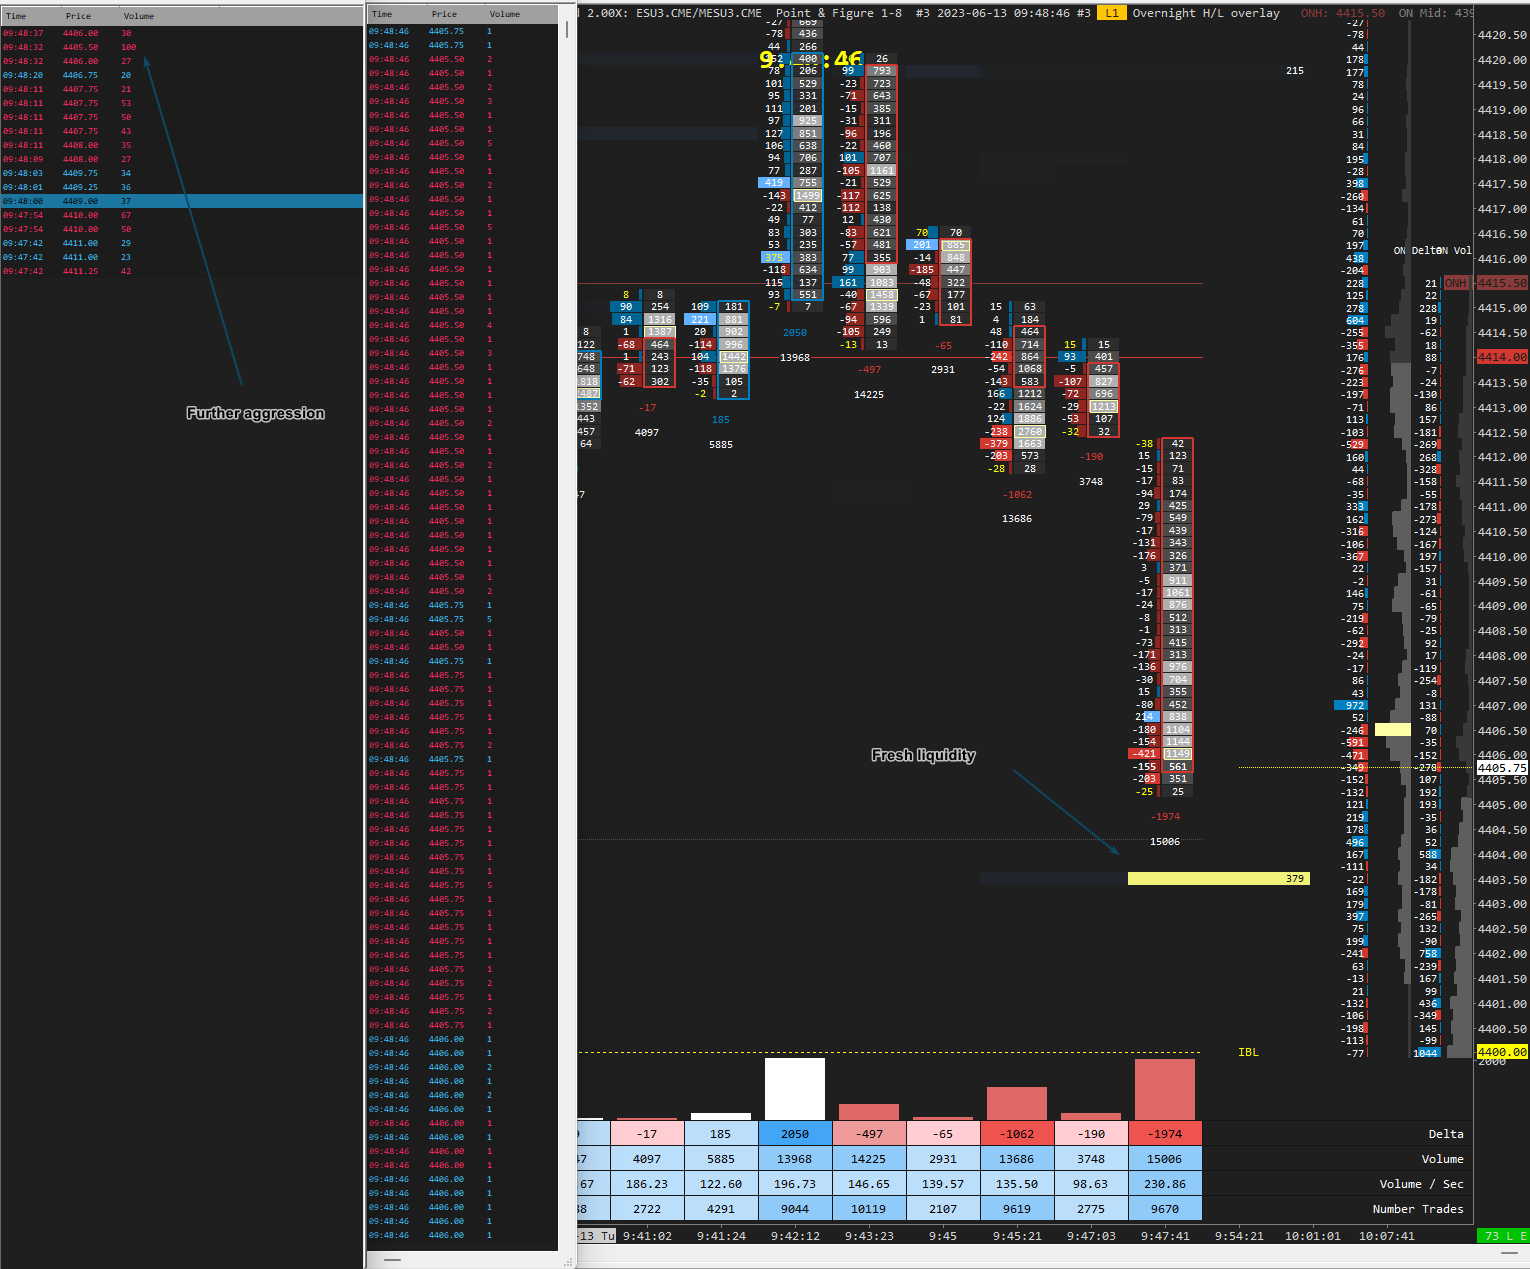
The pullback occurs, but the volume frequency hitting the Ask side is slow and predominantly composed of small sizes. There is no hint of imminent liquidations of open short positions.
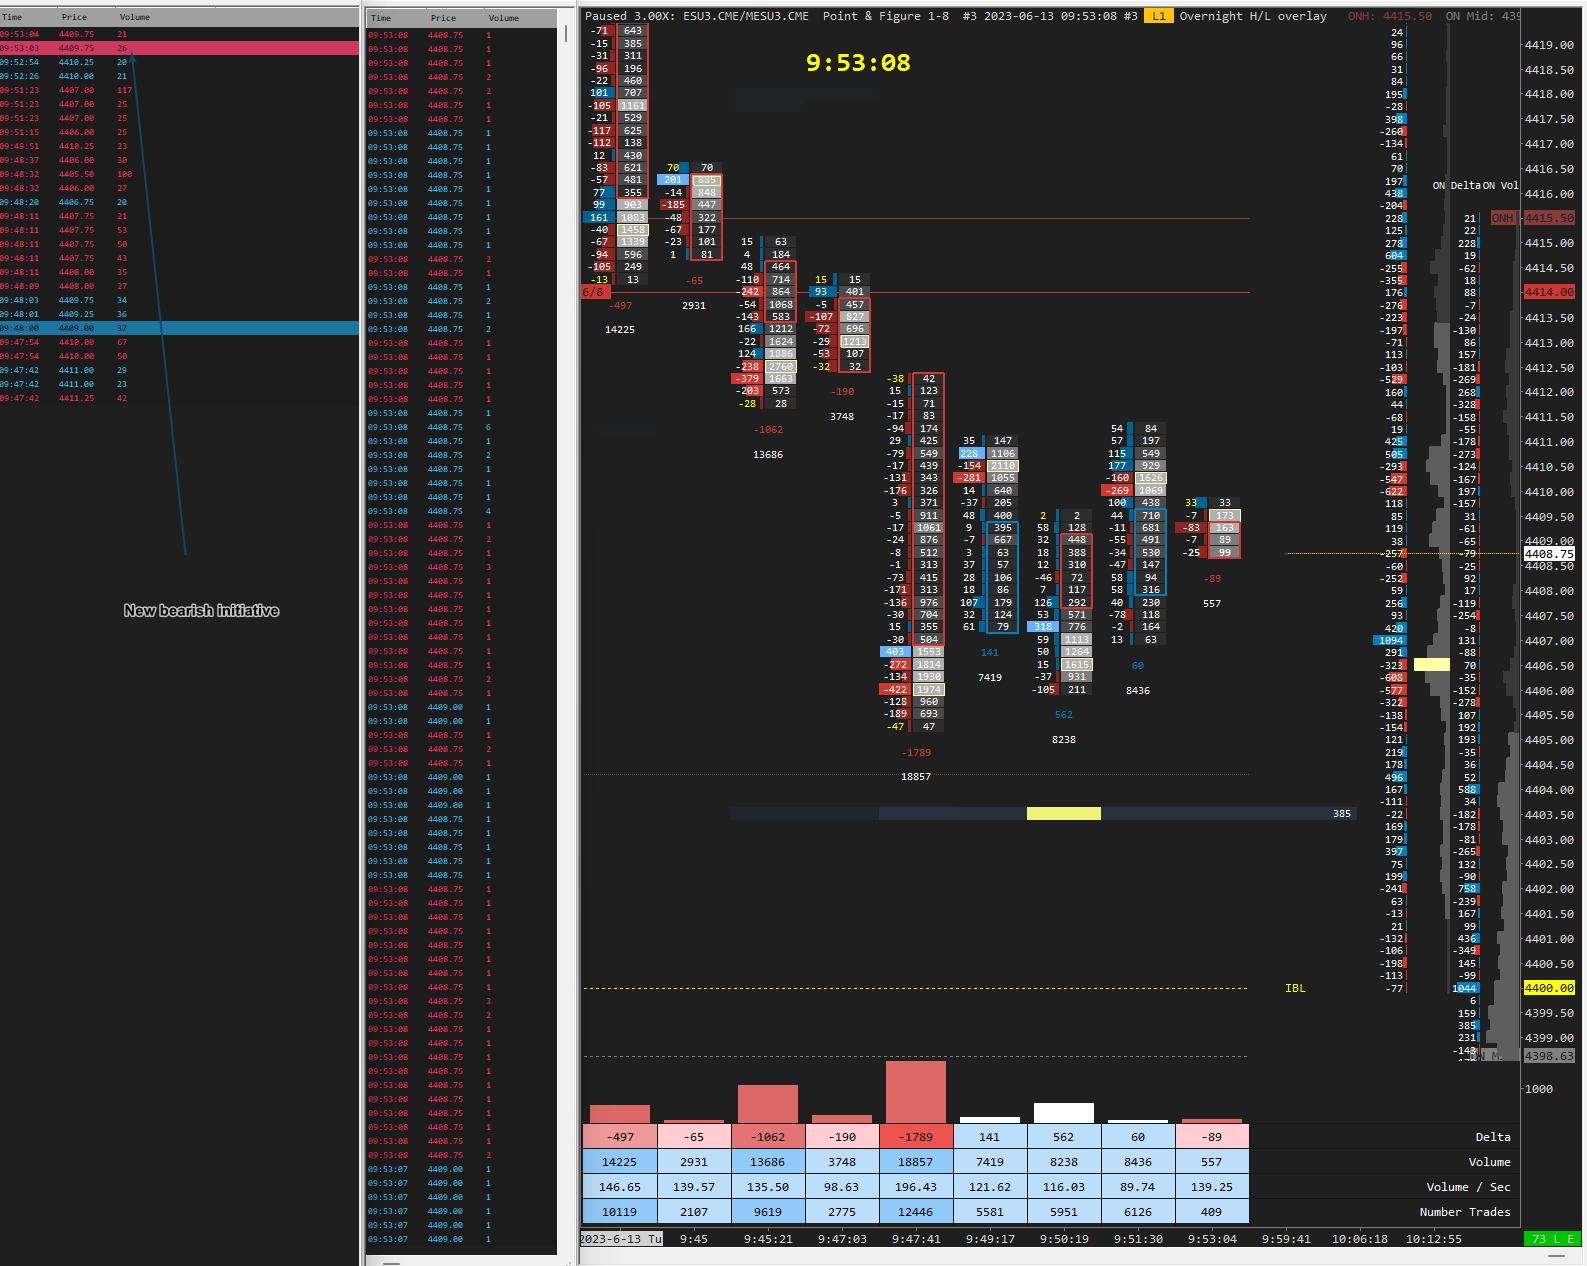
A new bearish initiative is highlighted on the filtered T&S, suggesting an imminent breakdown.
TL;DR
Time and Sales (T&S) is a tool that records the market orders that hit the Bid price and the Ask price, reporting the relative timestamp, executed price and the number of contracts. It can be used to understand the following:
Which category of market participants currently controls the auction (short-term vs other-timeframe);
Which size is effectively so much above average to cause a movement in the price;
What is the average speed of the market and, consequently, when to expect a reaction.
Time and Sales (T&S) can be unfiltered or filtered by size.
The unfiltered mode of the T&S allows the trader to understand the speed of the market; establish which sizes are abnormal; visualise sweeps in contexts of low liquidity; calibrate the filtered T&S.
The filtered mode of the T&S allows the trader to understand if the current movement is supported by sizes that can suggest the involvement of the other-timeframe within the auction.
Closing words
Unlike the heatmap, the Time and Sales window is not a "sexy" and visually appealing tool. Still, it's a handy tool for supporting multiple scalping techniques, and it allows the trader to familiarise themselves with the rhythm of the market.
Several mainstream indicators, such as "Speed of Tape" and "Iceberg detector", are calibrated precisely by considering the raw data and the various patterns identifiable on the T&S.
In the future, we will see together how to set up the T&S on different platforms and instruments, including Crypto markets.
Until then, happy trading!
If you liked this article, you might also like these previous ones:
The DayTrader’s Toolbox: Introduction to Bid x Ask split footprint candles
Evidence-Based Analysis EP.2 — AMT and the markets’ participants
This article is sponsored by SaviusLLC, the only prop firm with fair rules for swing traders and supporting EUREX symbols